The short version
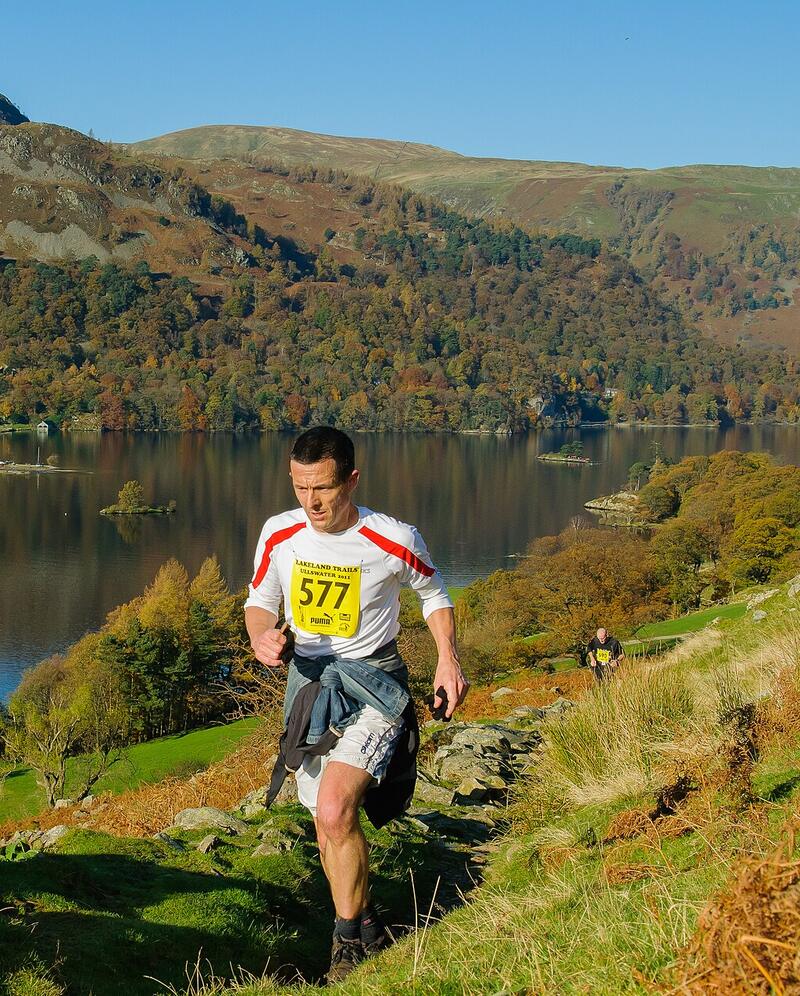
- Cooler than most people think. Across 1.8 million marathon finishes, the fastest average times came at air temperatures of about 39–50°F (4–10°C), depending on the runner’s level.1 We treat 45°F (7°C) to 55°F (13°C) as the sweet spot.
- Sticky air slows you down. Sweat only cools you when it evaporates, and that gets harder as the air holds more water.10 We use dew point, which measures that water directly.
- A headwind costs more than a tailwind gives back. The extra effort of running into wind rises with the square of the wind speed,15,16 and a following wind returns only part of it.17
- Thunder means stop. “If thunder can be heard, lightning is close enough to be a hazard.”20
- Darkness is the biggest road risk. 78% of US pedestrian deaths happen in the dark.22
The four ratings
When no start time is Good, the best Fair time is still named as the best time to run, because some seasons, like a Miami July, rarely offer anything better.
Every limit we use
Each check uses the worst forecast hour your run touches, plus 15 minutes after you finish. Temperatures are °F (°C); wind is mph (km/h).
| Factor | Fair conditions at | Poor conditions at |
|---|---|---|
| Heat | Air or feels-like 80°F (27°C) or above (75°F (24°C) on runs over 90 minutes) | Air 95°F (35°C) or feels-like 100°F (38°C) and above |
| Sticky air | Dew point 65°F (18°C) or above; very muggy from 70°F (21°C) (both 5°F lower on long runs) | — |
| Cold | Feels-like 14°F (-10°C) or below, or 32°F (0°C) or below with rain or snow possible | Air 10°F (-12°C) or feels-like -18°F (-28°C) and below |
| Cold rain | 50°F (10°C) or below with rain likely (55°F (13°C) on long or slow runs) | 40°F (4°C) or below with rain likely and wind 15 mph (24 km/h)+ on runs over 60 minutes |
| Wind | 15 mph (24 km/h) sustained (13 mph (21 km/h) waterfront), or gusts 20 mph (32 km/h) (18 mph (29 km/h) waterfront) | 25 mph (40 km/h) sustained, or gusts 30 mph (48 km/h) (25 mph (40 km/h) waterfront) |
| Rain | Chance 70%+, or 60%+ with 0.10 in (2.5 mm)+ expected, or 0.25 in (6.3 mm) in an hour | — |
| Snow and ice | Snow in the forecast | Freezing rain, freezing drizzle, sleet, ice pellets, heavy snow, blizzard |
| Thunder | “Slight chance” or “isolated” thunder on inland routes | “Chance” thunder or stronger, or any thunder with rain chance 40%+; any thunder on waterfront routes |
| Darkness and fog | 10+ minutes in the dark (before dawn or after dusk); fog; heavy rain | Dense fog with 10+ minutes of darkness |
| Official alerts (US) | Advisories and watches, such as Heat Advisory or Flood Watch | Warnings such as Tornado, Severe Thunderstorm, Flash Flood, Extreme Heat, Winter Storm or High Wind; coastal flood and surf alerts on waterfront routes |
Temperature and performance
Strong evidenceLarge race datasets agree on the direction: as temperature climbs past the cool 40s and 50s °F, most runners slow down and more drop out.
- An analysis of 1,791,972 finishes at six major marathons (Paris, London, Berlin, Boston, Chicago, New York, 2001–2010) found that the best temperature for speed ranged from 3.8°C to 9.9°C (39–50°F), depending on performance level. Above it, “running speed decreases and withdrawal rates increase.”1
- A study of 1,258 elite races across distances from 3,000 m to the marathon found peak performance most likely at 10–17.5°C (50–64°F) air temperature, with performance falling 0.3–0.4% for every degree of heat stress outside the best range.2
- Across seven North American marathons, slower finishers lost more time than the leaders as heat stress rose.3
- At the New York City Marathon (1.28 million finishers, 1970–2019), hot race days added an average of about 8 minutes to finish times.4 In Berlin, masters runners slowed on days warmer than 15°C (59°F).5
What we do. Among start times with the same rating, we rank cooler times higher, with no penalty from 45°F (7°C) to 55°F (13°C). That band sits between the marathon and elite findings, because most of our users run shorter and slower than marathon racers, and shorter runs build up less heat.
How hot is too hot
Moderate evidence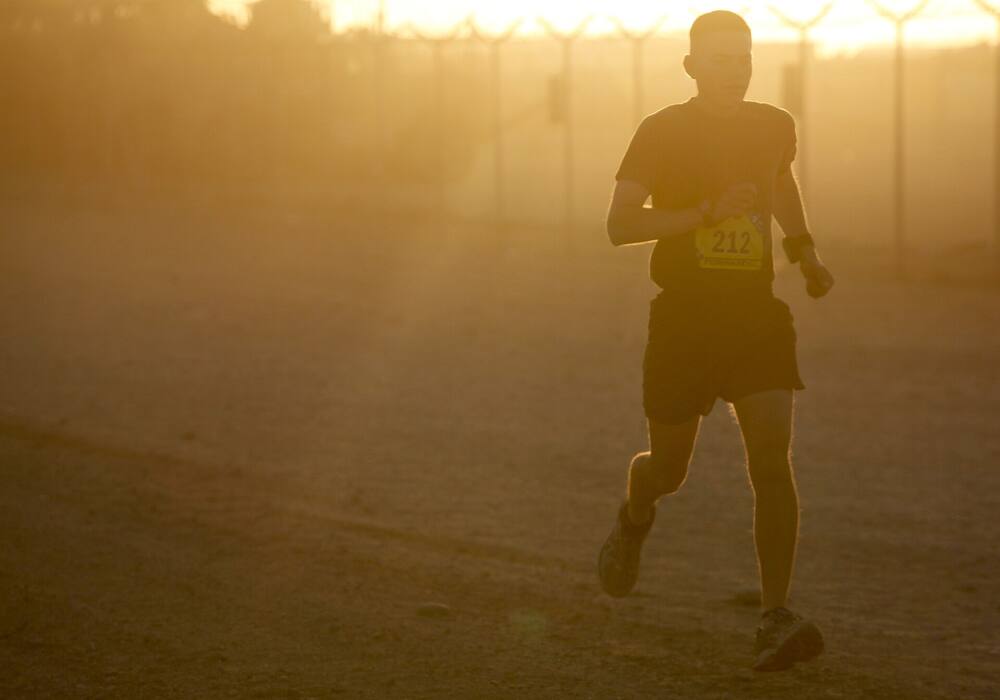
The American College of Sports Medicine says most exertional heat illness can be prevented by recognizing and managing known risk factors, including how hard and how long you run and whether you are used to the heat.7 The best-studied heat signal is the wet-bulb globe temperature (WBGT), which includes sunshine. At the Twin Cities Marathon, the rate of runners who didn’t finish or needed medical care rose quickly once the start WBGT passed 13°C (55°F), and the race had an area-wide mass-casualty event at a start WBGT of 22°C (72°F).6
No forecast gives WBGT, and estimating it without sunshine data can be off by several degrees in either direction. So we don’t show a WBGT number. We use air temperature and the National Weather Service “feels like” temperature instead. The NWS heat index assumes shade and a light wind, and full sun can raise it by up to 15°F (8°C).8 The NWS Caution band begins at a heat index of 80°F (27°C): “Fatigue possible with prolonged exposure and/or physical activity.”9
What we do. Fair from 80°F (27°C); poor from 95°F (35°C) air or 100°F (38°C) feels-like. Runs over 90 minutes use a 5°F lower fair line, because heat builds up the longer you are out. The poor limits are a conservative judgment, not a published cutoff: no study gives an air-temperature limit for recreational runners. If you feel dizzy, sick or chilled in the heat, stop and cool down.
Humidity: why we use dew point
Our judgmentYour body sheds most of its running heat by evaporating sweat, and evaporation depends on the gap in water vapor between wet skin and the air.10 Dew point is a direct measure of how much water vapor the air holds. Relative humidity is not: it swings with temperature through the day, so 70% humidity at dawn and 70% in the afternoon can mean very different air.
The race data are less clear than the physics. The six-marathon study found no significant effect of dew point once temperature was accounted for.1 So our dew point lines are a comfort judgment that matches common coaching advice, not a published threshold.
What we do. Fair from a dew point of 65°F (18°C) (sticky) and “very muggy” from 70°F (21°C), 5°F lower on long runs. Sticky air alone never makes a window poor; heat and thunder do.
Cold, wind chill and frostbite
Strong evidence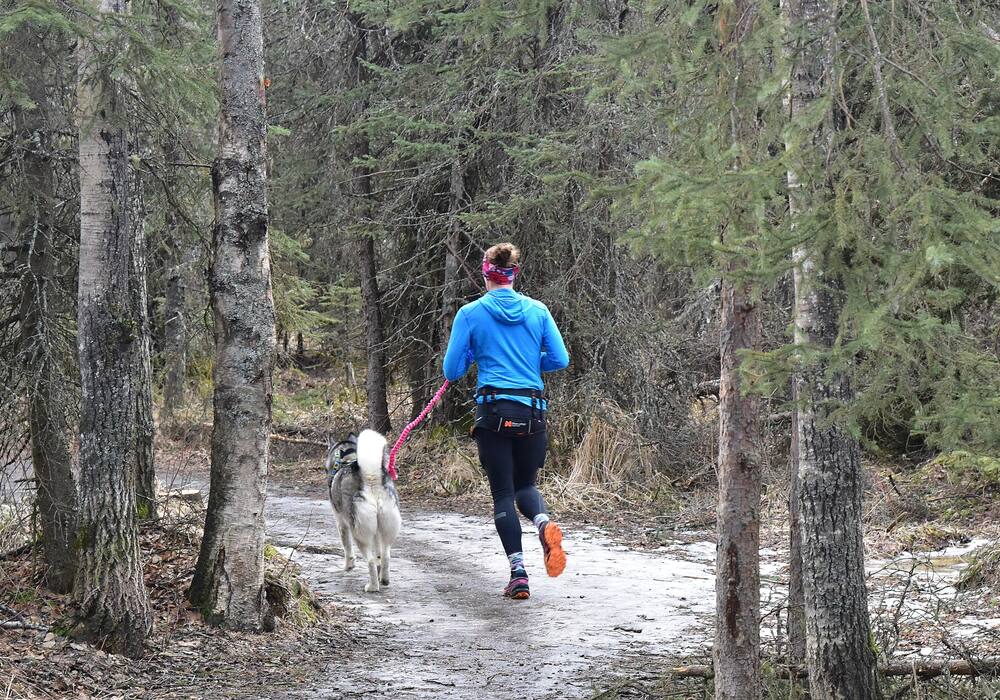
Wind chill estimates how fast bare skin loses heat. The NWS formula is 35.74 + 0.6215T − 35.75V0.16 + 0.4275TV0.16 (T in °F, V in mph). At 0°F with a 15 mph wind, the wind chill is −19°F and “exposed skin can freeze in 30 minutes.”11 The ACSM recommends closer watch of exercisers below a wind chill of −27°C (−18°F),12 and Environment Canada names a moderate risk from −10°C (14°F).13 The same ACSM statement notes that most cold-weather exercise can be done without cold injury.12
What we do. Dry cold above 14°F (-10°C) feels-like stays Good, with a dress-warmly note. Fair at 14°F (-10°C) feels-like or below, or at 32°F (0°C) or below when rain or snow could ice the path. Poor at -18°F (-28°C) feels-like, where frostbite can start within half an hour, or 10°F (-12°C) air, which is our judgment.
Cold rain and wind: the hypothermia mix
Our judgment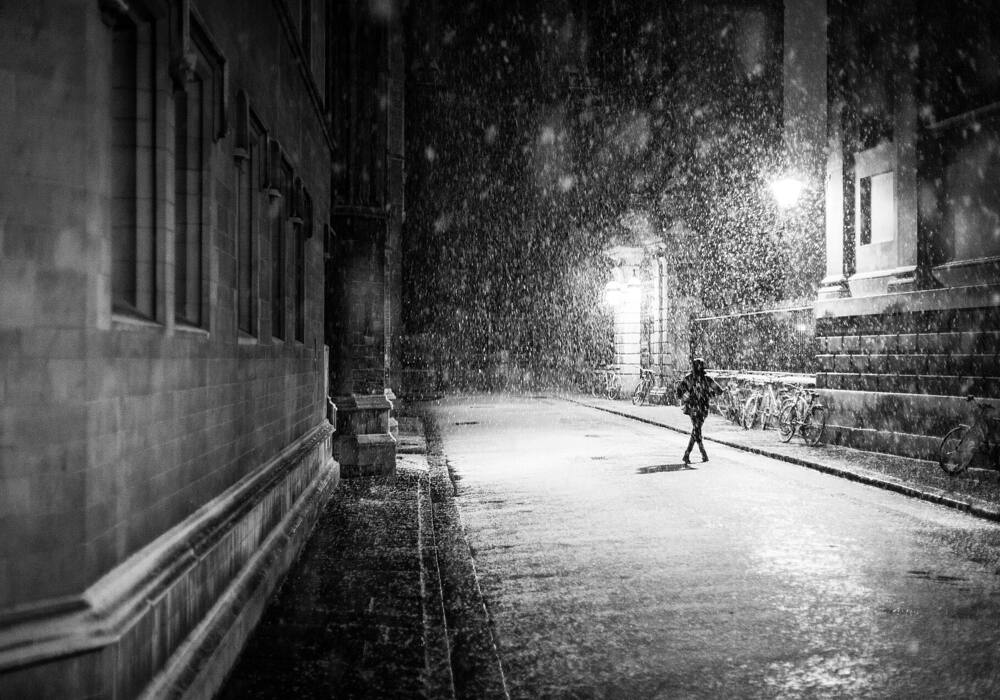
Being wet and in the wind strips heat far faster than dry cold. In May 2021, 21 runners died in a 100-km mountain race in Gansu, China, when sudden cooling, rain and strong wind hit the course.14 Mild-sounding air temperatures can still be dangerous when you are soaked, tiring and exposed.
What we do. Fair at 50°F (10°C) or below when rain is likely (55°F (13°C) for runs over 90 minutes or slower than 12 min/mile). Poor at 40°F (4°C) or below with rain likely and wind of 15 mph (24 km/h) or more on runs over an hour. There is no study that sets these exact numbers; they are a cautious reading of the incidents.
Wind
Moderate evidenceWind-tunnel studies found that the extra oxygen needed to run into a headwind rises with the square of wind speed.15,16 So doubling the wind roughly quadruples its cost. On a calm day, air resistance is only about 2% of the energy cost at marathon pace,17 which is why light breezes barely matter and strong winds matter a lot. A following wind helps less than a headwind hurts,17 so an out-and-back run in wind is slower overall than the same run in calm air. At 25–31 mph (40–50 km/h), “large branches [are] in motion” and umbrellas become hard to use; at 32–38 mph (51–61 km/h), walking into the wind is difficult.18
What we do. Fair at 15 mph (24 km/h) sustained or gusts of 20 mph (32 km/h); poor at 25 mph (40 km/h) sustained or gusts of 30 mph (48 km/h). Waterfront routes use lower lines, because open water and shorelines give the wind nothing to slow it down. When a forecast has no gust value, we estimate gusts at 1.5× the wind speed rather than assuming calm. Our ranking counts wind by its square, matching the physiology. The exact lines are our judgment.
Rain, snow and ice
Strong evidence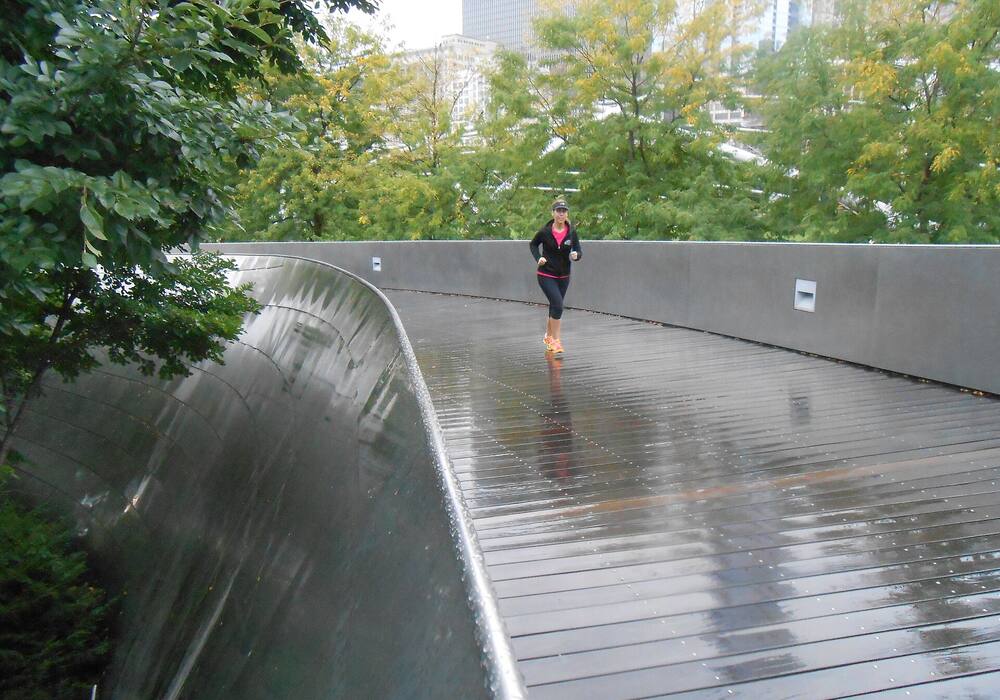
A “40% chance of rain” is the chance that at least 0.01 inch (0.25 mm) falls at your spot during that period.19 It is not 40% of the time or 40% of the area. It also says nothing about how hard it will rain. Light rain on a mild day is uncomfortable, not dangerous.
What we do. Rain chances under 70% stay Good with a note giving the odds. Fair at 70%, at 60% when real rain is expected during your run, or for heavy rain. Snow is Fair. Freezing rain, freezing drizzle, sleet, ice pellets, heavy snow and blizzards are Poor, because ice makes falls likely.
Thunderstorms
Strong evidenceThe National Athletic Trainers’ Association advises: “If thunder can be heard, lightning is close enough to be a hazard, and people should go to a safe location immediately,” and to wait until 30 minutes after the last thunder. Safe places are enclosed buildings with wiring and plumbing, or fully enclosed metal vehicles. “No place outside is safe when thunderstorms are in the area.”20 From 2006 to 2019, lightning killed 418 people in the US. Almost two-thirds were doing leisure activities, more than 70% of deaths came in June, July and August, and running accounted for 23% of the sports-related deaths.21
What we do. Any “Chance” of thunderstorms or stronger wording, or thunder with a rain chance of 40% or more, is Poor. On waterfront and exposed routes, any thunder is Poor. A “Slight chance” or “isolated” thunderstorm on an inland route is Fair, with advice to stay near shelter. That last choice is our judgment, made so that summer afternoons in humid places aren’t all rated Poor for a 1-in-5 chance. If you hear thunder, go inside.
Darkness and fog
Strong evidence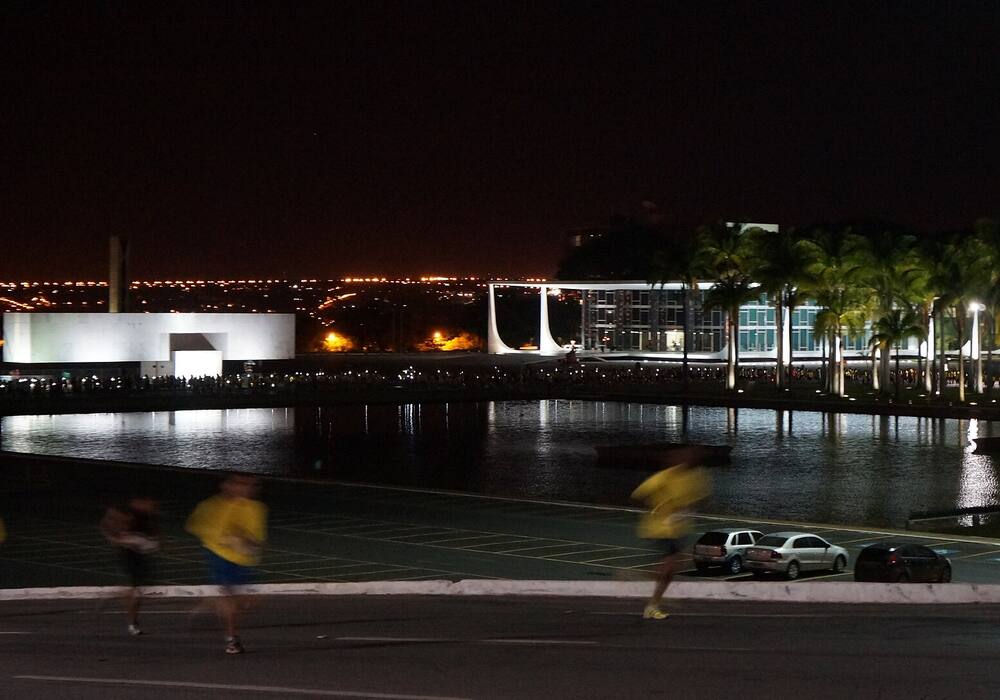
In 2022, 78% of US pedestrian deaths happened in the dark, and NHTSA’s definition of pedestrian includes people running and jogging.22 In a closed-road test at night, drivers recognized only 5% of pedestrians in black clothing under low beams with glare. Without glare, they recognized 100% of pedestrians wearing reflective markings on their moving joints.23 The NWS issues dense fog advisories when visibility often drops to a quarter mile (0.4 km) or less.24
What we do. Fair when 10 or more minutes of the run are in the dark, meaning before dawn or after dusk, the ends of civil twilight,25 or when fog or heavy rain is forecast. Poor for dense fog in the dark. The half-light between dawn and sunrise, or sunset and dusk, is shown on the start-time strip and in each window but does not change the rating: in civil twilight there is normally enough light to see and be seen, so we count only true darkness. Whenever any part of a run is dark or in the half-light, we suggest reflective gear on ankles and wrists and a light.
Sun and UV
Strong evidenceThe World Health Organization’s UV index runs from 0 upward: 3–5 is moderate, 6–7 high, 8–10 very high and 11 or more extreme, with sun protection advised from 3 and extra protection from 8.26 UV is strongest in the middle of the day and does not depend on how warm the air feels.
What we do. We show the UV index for each window. The National Weather Service hourly forecast does not include it, so for every location the index comes from Open-Meteo’s hourly forecast; when that source is unavailable the window says so rather than guessing. From an index of 6 we add sunscreen, cap and sunglasses advice. UV never changes a rating: no study ties it to running performance or acute risk the way heat, thunder and darkness are tied.
How we pick the best time
Good beats Fair, and Fair beats Poor. Among start times with the same rating, we add up a small penalty for each factor, averaged over the time you are actually out:
- temperature away from the 45°F (7°C) to 55°F (13°C) sweet spot, with heat counting more than cold
- dew point above 55°F (13°C)
- wind, counted by its square
- gusts above the sustained wind
- rain chance
- minutes of darkness
We use dew point as the only moisture term, so one hot, humid hour isn’t counted several times. These weights are our judgment; no study ranks runners’ preferences across all of these factors at once.
Your comfort settings
Our judgmentUnder Adjust my run you can tell the planner how you handle heat, cold and rain, and whether you would rather run in daylight. These settings move only the Fair lines and the ranking. The Poor limits above (thunder, ice, extreme heat and cold, dangerous wind, official warnings) never move, whatever you choose, and nothing you set is stored anywhere but your own browser.
- Heat tolerance. High raises the Fair heat and dew-point lines by 5°F (3°C), and the ranking sweet spot with them; low lowers them by the same. Five degrees is the cap because how used to heat you are is the biggest single factor in heat-illness risk, and the app cannot measure it.7
- Cold gets to me. Fair from a feels-like of 32°F (0°C) instead of 14°F (-10°C), the cold-rain line 5°F warmer, and cooler starts rank lower.
- Rain is fine. Rain chance alone makes a window Fair only from 90% (80% with measurable rain expected) instead of 70% (60%), and rain weighs half as much in the ranking. The cold-rain, heavy-rain and thunder rules do not move.
- I’d rather run in daylight. Minutes in the dark weigh three times as much in the ranking, so an evening start loses to a lunchtime one more often. The Fair line for darkness does not move.
What this can’t tell you
- It’s a forecast. Forecasts describe one point and can be wrong. Conditions change along a route and through the day.
- You are not an average. Fitness, heat acclimatization, medications, illness and clothing all change your risk. A Good rating doesn’t mean a run carries no risk.
- We say where the evidence is thin. Each section above is marked Strong evidence (large studies or official guidance directly on the point), Moderate evidence (consistent but indirect), or Our judgment (a cautious choice where no study sets the number).
- Not medical advice. If you feel dizzy, confused, sick or very cold on a run, stop and get help.
Sources
- El Helou N, Tafflet M, Berthelot G, et al. Impact of environmental parameters on marathon running performance. PLoS ONE 2012;7(5):e37407. doi:10.1371/journal.pone.0037407
- Mantzios K, Ioannou LG, Panagiotaki Z, et al. Effects of weather parameters on endurance running performance: discipline-specific analysis of 1258 races. Med Sci Sports Exerc 2022;54(1):153–161. doi:10.1249/MSS.0000000000002769
- Ely MR, Cheuvront SN, Roberts WO, Montain SJ. Impact of weather on marathon-running performance. Med Sci Sports Exerc 2007;39(3):487–493. doi:10.1249/mss.0b013e31802d3aba
- Knechtle B, McGrath C, Goncerz O, et al. The role of environmental conditions on master marathon running performance in 1,280,557 finishers the “New York City Marathon” from 1970 to 2019. Front Physiol 2021;12:665761. doi:10.3389/fphys.2021.665761
- Knechtle B, Valero D, Villiger E, et al. Trends in weather conditions and performance by age groups over the history of the Berlin Marathon. Front Physiol 2021;12:654544. doi:10.3389/fphys.2021.654544
- Roberts WO. Determining a “do not start” temperature for a marathon on the basis of adverse outcomes. Med Sci Sports Exerc 2010;42(2):226–232. doi:10.1249/mss.0b013e3181b1cdcf
- Roberts WO, Armstrong LE, Sawka MN, et al. ACSM expert consensus statement on exertional heat illness: recognition, management, and return to activity. Curr Sports Med Rep 2021;20(9):470–484. doi:10.1249/JSR.0000000000000878
- National Weather Service. What is the heat index? weather.gov/safety/heat-index
- National Weather Service, Amarillo. Heat index chart and categories. weather.gov/ama/heatindex
- Kenney WL, Lewis DA, Hyde DE, et al. Physiologically derived critical evaporative coefficients for protective clothing ensembles. J Appl Physiol 1987;63(3):1095–1099. doi:10.1152/jappl.1987.63.3.1095
- National Weather Service. Wind chill chart and wind chill brochure. weather.gov/safety/cold-wind-chill-chart
- Castellani JW, Young AJ, Ducharme MB, et al. American College of Sports Medicine position stand: prevention of cold injuries during exercise. Med Sci Sports Exerc 2006;38(11):2012–2029. doi:10.1249/01.mss.0000241641.75101.64
- Environment and Climate Change Canada. Wind chill index. canada.ca
- Sun J. Energy supply and influencing factors of mountain marathon runners from Baiyin marathon accident in China. Sci Rep 2022;12:8179. doi:10.1038/s41598-022-12403-1
- Pugh LGCE. Oxygen intake in track and treadmill running with observations on the effect of air resistance. J Physiol 1970;207(3):823–835. doi:10.1113/jphysiol.1970.sp009097
- Pugh LGCE. The influence of wind resistance in running and walking and the mechanical efficiency of work against horizontal or vertical forces. J Physiol 1971;213(2):255–276. doi:10.1113/jphysiol.1971.sp009381
- Davies CTM. Effects of wind assistance and resistance on the forward motion of a runner. J Appl Physiol 1980;48(4):702–709. doi:10.1152/jappl.1980.48.4.702
- National Weather Service, Miami. Beaufort wind scale. weather.gov/mfl/beaufort
- National Weather Service, Binghamton. Forecast terms: probability of precipitation. weather.gov/bgm/forecast_terms
- Walsh KM, Cooper MA, Holle R, et al. National Athletic Trainers’ Association position statement: lightning safety for athletics and recreation. J Athl Train 2013;48(2):258–270. doi:10.4085/1062-6050-48.2.25
- Jensenius JS Jr. A detailed analysis of lightning deaths in the United States from 2006 through 2019. National Weather Service, 2020. weather.gov (PDF)
- National Highway Traffic Safety Administration. Traffic Safety Facts, 2022 data: Pedestrians. DOT HS 813 590, 2024. crashstats.nhtsa.dot.gov
- Wood JM, Tyrrell RA, Carberry TP. Limitations in drivers’ ability to recognize pedestrians at night. Hum Factors 2005;47(3):644–653. doi:10.1518/001872005774859980
- National Weather Service, Albany. Fog fact sheet. weather.gov (PDF)
- U.S. Naval Observatory, Astronomical Applications Department. Rise, set, and twilight definitions. aa.usno.navy.mil/faq/RST_defs
- World Health Organization. Global solar UV index: a practical guide. Geneva: WHO, 2002. who.int